In June 2026, a website I operate experienced a substantial drop in organic traffic. The following month, Google Search Console showed a recovery: clicks from Croatia increased by more than 400%.
But according to DataForSEO’s historical organic traffic estimates, traffic had continued declining.
Both datasets described the same website and approximately the same search market. Yet they suggested opposite performance trends.
That raised a question I’ve encountered frequently in SEO work: how much can we actually trust third-party organic traffic estimates?
We routinely use SEO tools to evaluate competitors, estimate market opportunities, and understand how other websites perform. Their numbers can influence which competitors we investigate, which topics we prioritize, and how we forecast potential traffic.
The problem is that we rarely know how accurate those estimates are. After all, we don’t have access to our competitors’ Google Search Console accounts.
In this case, I did have access to the first-party data.
So I compared 15 months of DataForSEO historical traffic estimates against Google Search Console clicks to see how closely they matched.
The results were more interesting than a simple overestimation or underestimation.
The experiment
The website is a relatively small, independently operated content site targeting the Croatian market.
Its traffic is highly event-driven, with search activity fluctuating around particular dates. This makes it an interesting test case, although it also limits how broadly the findings can be applied.
I compared two datasets covering July 2025 through September 2026.
Google Search Console provided observed clicks from Google Web Search. I used the Search Analytics API to retrieve finalized daily data, filtered to searches originating in Croatia, and aggregated it into monthly totals.
DataForSEO provided historical organic Estimated Traffic Volume (ETV) through its Historical Rank Overview endpoint, configured for Google in Croatia with Croatian as the language.
According to DataForSEO’s documentation, ETV is calculated using keyword search volumes and estimated click-through rates based on ranking positions.
That distinction matters: ETV is an estimate of potential monthly organic traffic, not a measurement of actual clicks.
For the Search Console extraction, I used property-level aggregation rather than adding up individual keyword or landing-page rows. Google can omit anonymized queries and limit the rows returned in more granular reports, making those totals unsuitable for this comparison.
The export covered 457 consecutive days, with no missing dates.
An important limitation
The datasets aren’t perfectly comparable.
DataForSEO’s estimates represent the Croatia/Croatian market. Search Console’s geographic filter includes searches originating in Croatia, regardless of language.
The GSC data also came from a URL-prefix property, while DataForSEO analyzed the domain.
These differences could explain some of the discrepancies.
This is therefore not a controlled test of DataForSEO’s absolute estimation accuracy. It’s a comparison of how two practically relevant, but imperfectly aligned, indicators described the same website’s performance.
Finding 1: The tools frequently disagreed about traffic direction
This was the most important finding.
Across 14 month-to-month changes, DataForSEO and Google Search Console agreed on whether traffic was increasing or decreasing only six times.
In the other eight, one indicated growth while the other indicated a decline.
Consider June to July 2026.
According to Search Console, clicks originating in Croatia increased by approximately 423%.
DataForSEO estimated a decline of approximately 21%.
If I had been evaluating this website as a competitor using only DataForSEO, I would have seen a decline during a period when its observed Google clicks had recovered substantially.
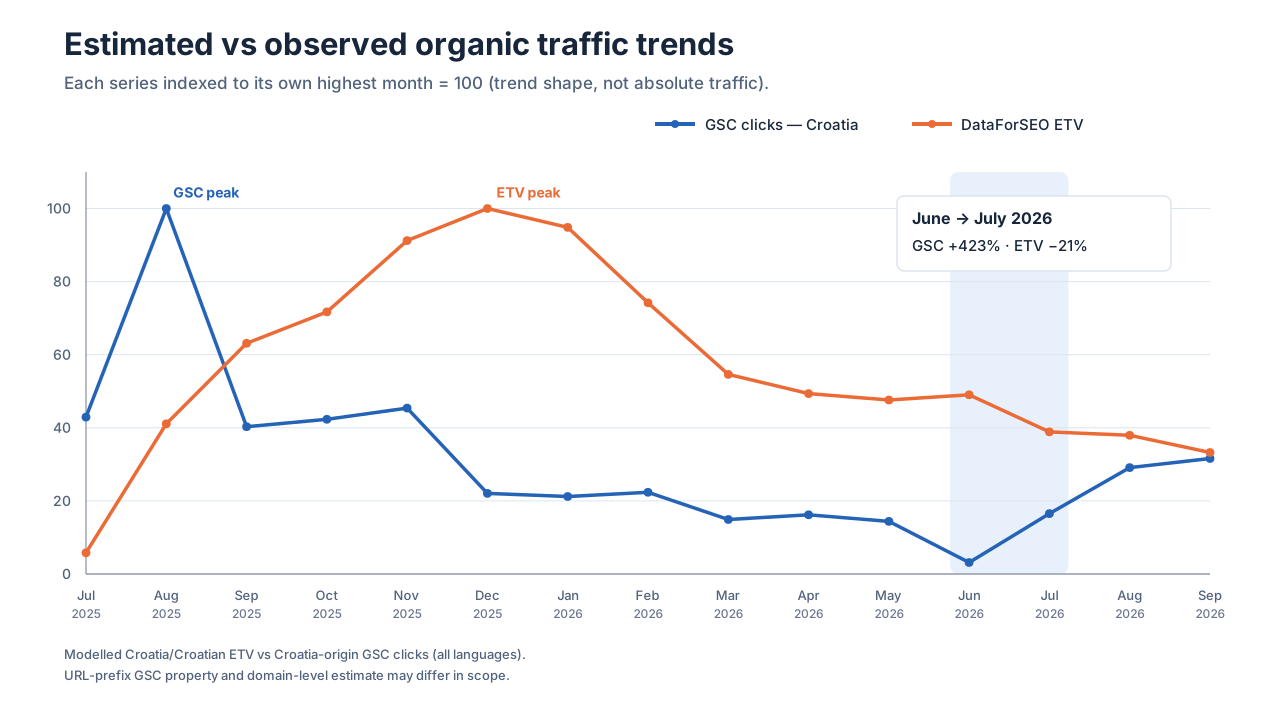
Figure 1. Each series is indexed to its own peak month (100). This compares monthly trends, not absolute traffic volumes.
The datasets also identified different traffic peaks.
Observed Croatian Google clicks peaked in August 2025. DataForSEO’s estimates peaked four months later, in December.
Across the full comparison, the two series showed little correlation.
Of course, 15 months from one website aren’t enough to establish how DataForSEO performs generally.
But for this particular website, during this period, its estimated traffic trend wasn’t a dependable representation of observed monthly Google clicks.
That’s a meaningful limitation when evaluating competitor performance.
Finding 2: The estimates weren’t consistently high or low
I expected the estimated numbers to differ from Search Console. What surprised me was how much that difference changed over time.
Across the 15 months, the median ratio between DataForSEO’s estimated traffic and GSC’s observed Croatian clicks was approximately 1.8×.
In simpler terms, the middle value of the 15 monthly comparisons showed an estimate roughly 80% higher than the observed click count.
That might sound like a fairly predictable overestimate.
But it wasn’t.
In one month, DataForSEO estimated only about one-tenth of the clicks reported by GSC. In another, its estimate was nearly twelve times higher.
The direction and size of the difference kept changing.
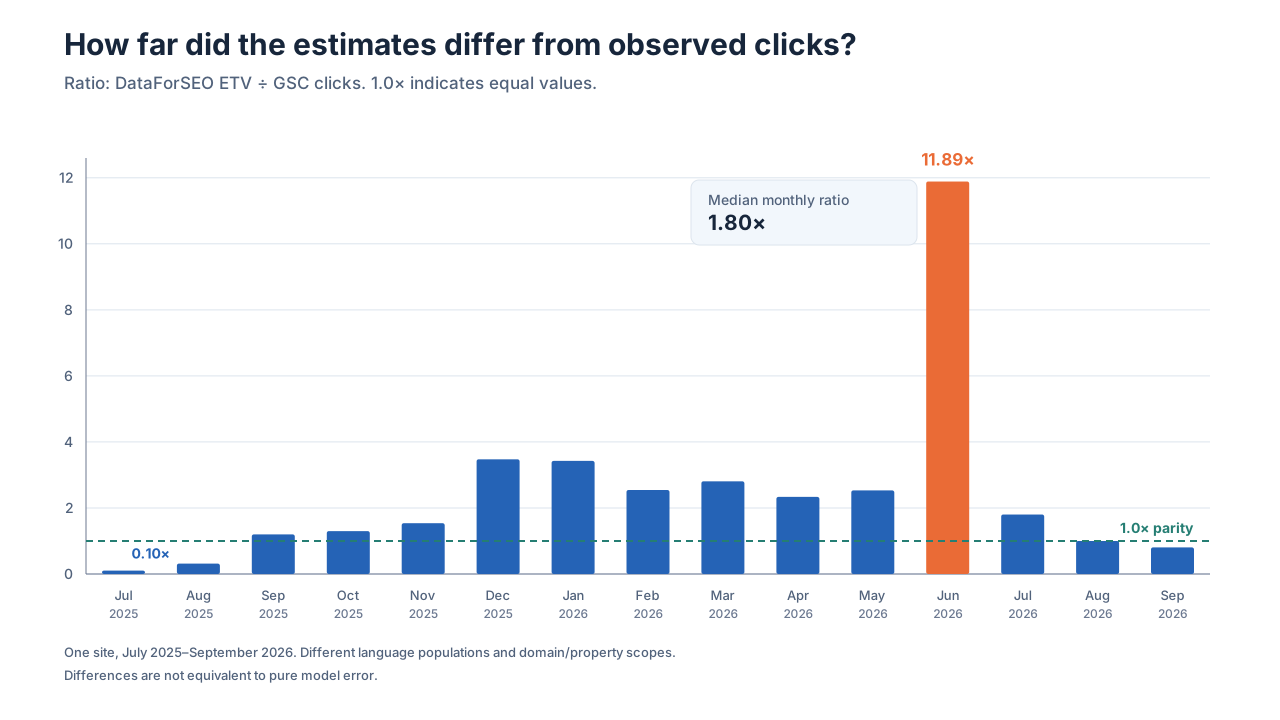
Figure 2. The estimated-to-observed ratio varied substantially. These are imperfectly matched populations, so differences are not pure model error.
Why does this matter?
A consistently high or low estimate can still be useful for tracking trends. If a tool always estimated roughly twice the actual traffic, for example, you might still learn something useful from how its numbers change over time.
But when that relationship varies dramatically, even relative comparisons become harder to trust.
You can’t assume that a website estimated to receive twice as much traffic as before has actually doubled its Google clicks.
The change might reflect real performance, changes in the data feeding the model, or a combination of both.
Why might the estimates have diverged?
I wanted to understand what could explain these discrepancies rather than stop at showing that the numbers were different.
The existing data provides a few clues.
None proves a specific cause, but together they help explain why this type of website might be difficult to model.
1. Traffic is concentrated around specific events
Unlike an evergreen informational website with relatively stable demand, this site experiences substantial traffic fluctuations around particular dates.
I examined a separate historical daily GSC export to understand that pattern.
In September 2025, the three highest-traffic days generated approximately 55% of the month’s worldwide Google Search clicks.
Two days alone accounted for approximately 47%.
Both coincided with major sporting events relevant to the website’s audience.
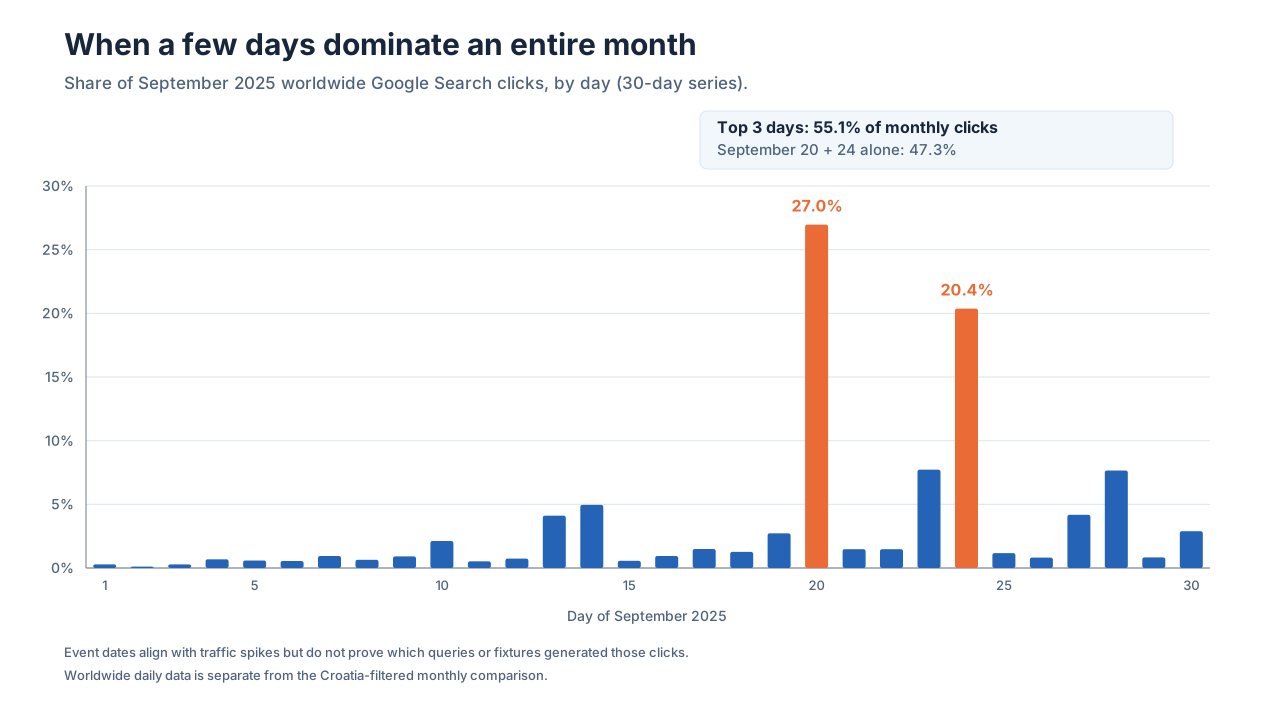
Figure 3. September 2025 worldwide GSC clicks were concentrated into a few days. This daily dataset has a different geographic scope from the main Croatia-filtered comparison.
There’s another interesting detail.
The highest-traffic day accounted for approximately 27% of September’s clicks and 29% of its impressions. Its click-through rate was actually slightly below the monthly average.
In other words, the spike was associated with a substantial increase in search exposure, not an unusually high percentage of impressions turning into clicks.
That doesn’t tell us whether the increase came from greater search demand, more queries triggering the website, improved rankings, or some combination of these factors.
The sporting events are a plausible explanation for part of the spike, but confirming their contribution would require query-level evidence for those dates.
Still, the concentration itself is significant.
A traffic estimation model based on keyword volumes and ranking positions may struggle to reflect short-lived changes in demand with the same timing as observed clicks.
This is worth considering when analyzing websites covering sports, entertainment, breaking news, or other time-sensitive subjects.
Methodological note: this daily example uses worldwide GSC data from a separate export. The main monthly comparison uses Croatia-filtered clicks. The daily data illustrates traffic concentration rather than a directly matched DataForSEO comparison.
2. More ranking keywords didn’t mean more clicks
Another interesting pattern appeared between August and December 2025.
During that period, DataForSEO’s reported organic ranking entries increased from 127 to 538. The number of top-10 entries grew from 34 to 135.
Its estimated traffic increased by approximately 143%.
But observed Croatian Google clicks moved in the opposite direction, declining by approximately 78%.
The website appeared to be gaining ranking coverage while attracting fewer actual search clicks.
These aren’t necessarily contradictory outcomes.
A website can rank for more keywords without receiving more traffic. Those additional keywords might have lower search demand. Demand for existing keywords might decline. Or the distribution of rankings and clicks might change.
The historical data doesn’t let me determine which factors were responsible.
But it demonstrates an important distinction: ranking visibility and actual search traffic aren’t interchangeable.
More ranking keywords don’t automatically mean more clicks.
3. Traffic estimation models make assumptions
DataForSEO’s ETV calculation relies on keyword search volumes and estimated click-through rates.
That isn’t inherently problematic. Without first-party analytics, using search-demand and ranking data to estimate traffic is a reasonable approach.
But the estimate depends on which keywords the model tracks, the quality and timing of its search-volume data, and the assumptions used to translate rankings into clicks.
Short-lived demand spikes can be difficult to represent using historical search volumes. Changes in keyword coverage can also affect estimated traffic without corresponding changes in actual clicks.
There’s another relevant detail.
In September 2026, DataForSEO announced an updated ETV calculation, incorporating additional information about SERP features, search intent, and clickstream-normalized search volumes.
At the time, the update explicitly excluded endpoints returning historical metrics.
Because my experiment used historical data retrieved in October 2026, these findings shouldn’t be presented as an evaluation of the newer model.
Nor can I conclude that the update would necessarily resolve the discrepancies.
The evidence shows that the historical estimates and observed clicks diverged. It doesn’t establish exactly why.
What this means when researching competitors
This experiment matters beyond DataForSEO.
SEO specialists regularly analyze websites whose first-party performance data isn’t available.
We use estimated traffic charts to assess competitor growth, identify successful content, and understand market opportunities.
There’s nothing wrong with that.
The problem starts when we treat estimated metrics as observations.
If a tool reports that a competitor’s organic traffic increased by 60%, that doesn’t necessarily mean the website received 60% more Google clicks.
It means the tool’s model produced an estimate 60% higher than before.
Sometimes that will reflect real growth. Other times, changes in rankings, keyword coverage, search demand, or model assumptions may contribute.
So how should we use these numbers?
Discover opportunities
Third-party SEO tools remain useful for identifying competitors, keywords, relevant pages, and gaps in search visibility.
This experiment doesn’t change that.
Understand relative visibility
Estimated traffic can provide a rough picture of organic search visibility, particularly when considered alongside rankings and keyword distribution.
But I wouldn’t assume the relationship between estimated traffic and actual clicks is stable across websites, niches, or time periods.
Investigate performance changes
This is where I’d be most cautious.
If a competitor’s estimated traffic suddenly increases or decreases, I’d treat that as a signal to investigate rather than proof that their SEO performance has changed.
I’d look at which keywords gained or lost rankings, whether new pages appeared, how the site’s ranking coverage changed, and whether seasonality could explain the movement.
For decisions with meaningful commercial consequences, I’d want corroborating evidence before drawing conclusions.
That’s especially important when evaluating a competitor’s strategy, entering a new market, or forecasting the return from content investment.
Are traffic estimates still worth using?
Yes.
This experiment hasn’t changed my view that third-party SEO data is valuable. It has changed how much confidence I place in certain interpretations.
I’ll continue using estimates to discover competitors, identify opportunities, understand search visibility, and form hypotheses.
What I’m less comfortable doing is using a single estimated traffic curve as evidence that a competitor’s organic performance has improved or deteriorated.
An estimate doesn’t have to be an accurate measurement to be useful.
But there’s a difference between using data to identify something worth investigating and treating that data as proof of what happened.
Conclusion
Comparing 15 months of DataForSEO estimates against Google Search Console revealed substantial disagreement in both traffic magnitude and direction.
For this website, monthly estimates varied widely relative to observed clicks. The two datasets frequently indicated opposite trends and identified different peak periods.
The site’s event-driven traffic pattern offers one possible explanation. Changes in ranking coverage and the assumptions behind keyword-based estimates may also contribute.
I can’t determine precisely how much each factor explains. And I wouldn’t generalize the results to every DataForSEO customer, industry, or competing SEO platform.
What I can say is that, for this website, the historical estimates weren’t dependable enough to reconstruct monthly Google traffic performance.
I’ll still use SEO traffic estimates, because they provide information I often can’t obtain elsewhere.
But the next time an estimated traffic chart shows a dramatic rise or decline, I’ll be more careful about what I conclude from it.
A traffic estimate is a useful starting point for investigation. It isn’t necessarily evidence of what actually happened.
Methodology and references
The analysis covers 15 complete calendar months, July 2025–September 2026, using finalized Google Search Console Web Search data aggregated at property level and historical DataForSEO Labs Google ETV estimates.
The main comparison is between searches originating in Croatia (all languages) and estimated traffic for the Croatia/Croatian market. These are not identical populations.
A separate worldwide daily GSC export supplies the September 2025 traffic-concentration example.
The data comes from a website I operate. I’ve omitted its identity, and the findings concern only this historical comparison.
Technical references: